Carbon Footprint vs TCO Analysis for Power Transformer Design

1. Overview
Due to global warming, reducing greenhouse gas emissions is a critical issue. A significant portion of losses in power transmission systems comes from power transformers. To reduce greenhouse gas emissions in power systems, more efficient transformers must be installed. However, more efficient transformers often require more manufacturing materials. To determine the optimal loss ratio and manufacturing price of transformers, the Total Cost of Ownership (TCO) method is the industry standard practice. The TCO formula considers the purchase price (PP) and the cost of losses during the product's planned life period (PPL). This method accounts for the price of losses through capitalization factors (A, B).
However, this approach only considers the direct electricity costs of transformers during their planned service life. Indirect impacts involving ecological resources, manufacturing infrastructure, installation, and support systems are not considered. For example, these electrical products are often refurbished and/or reused after retirement. Taking power transformers as an example, 73% of the applied materials can be recycled, and this percentage can be further increased when using natural ester-based insulating oil. The benefits of material recycling and remanufacturing are not taken into account.
Carbon footprint is another metric for determining the environmental impact of electrical equipment during its service life. Currently, there is no widely accepted method for calculating the carbon footprint of power equipment. Different calculation tools often yield significantly different results. This paper proposes a carbon footprint analysis method and applies it to transformer optimization. The resulting transformers are compared with those based on the TCO method.
2. Total Cost of Ownership Method
The TCO formula represents the life cycle cost of a product from purchase to final retirement. Another commonly used term is Life Cycle Cost (LCC). The primary goal is to compare transformers on an equal basis to make purchasing decisions. The standardized form of the TCO method during the bidding phase is as follows:
TCO = PP + A · PNLL + B · PLL (1)
Where A is the no-load loss coefficient (€/kW), B is the load loss coefficient (€/kW), PNLL (kW) is the no-load loss of the transformer over its entire life, and PLL (kW) is the load loss of the transformer over its entire life.
From the perspective of power utilities or industrial and commercial users, TCO calculations also differ. Power utility transformer loss evaluation procedures involve understanding and assessing the total cost of transformer generation, transmission, and distribution losses, resulting in complex calculation formulas. On the other hand, industrial and commercial users' transformer loss evaluation procedures require understanding and assessing electricity prices over the transformer's planned usage time.
A. Details of Analysis Scenario
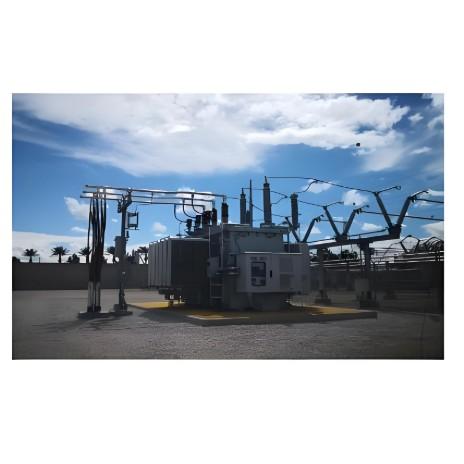
The coefficients (A, B) were calculated for a 16MVA power transformer connected to a solar power plant (Figure 1). We used a standardized method to determine the values of A and B in our calculations.

For this purpose, it is necessary to solve the following equation:

3. Carbon Footprint Analysis
Our goal is to create a methodology to determine and compare the optimal carbon footprint (CF) for power transformers. "CF measures the total amount of carbon dioxide emissions directly or indirectly caused by an activity or accumulated during a product's life cycle." It can also represent the total amount of carbon dioxide (CO2) and other greenhouse gas (GHG) emissions (such as methane, nitrous oxide, etc.) associated with a product. CF is a subset of the data covered by the more comprehensive Life Cycle Assessment (LCA). LCA is an internationally standardized methodology (ISO 14040, ISO 14044) used to evaluate environmental burdens and resource consumption throughout a product's life cycle. Therefore, CF is a life cycle assessment limited solely to emissions that impact climate change.
There are two primary methods for CF calculation: bottom-up process-based analysis (PA) or top-down environmentally extended input-output (EIO) analysis. Process analysis (PA) is a bottom-up approach that considers the environmental impact of an individual product from production to disposal. Environmental input-output (EIO) analysis is based on a top-down approach to estimate CF.
The Product Attribute to Impact Algorithm (PAIA) provides a universal method for calculating the CF of different types of electrical products, such as lighting fixtures, rotating electrical machines, etc. This method calculates the CF of motors during manufacturing, operation, and recycling phases. However, the PAIA method has not yet been applied to CF evaluation of power transformers.
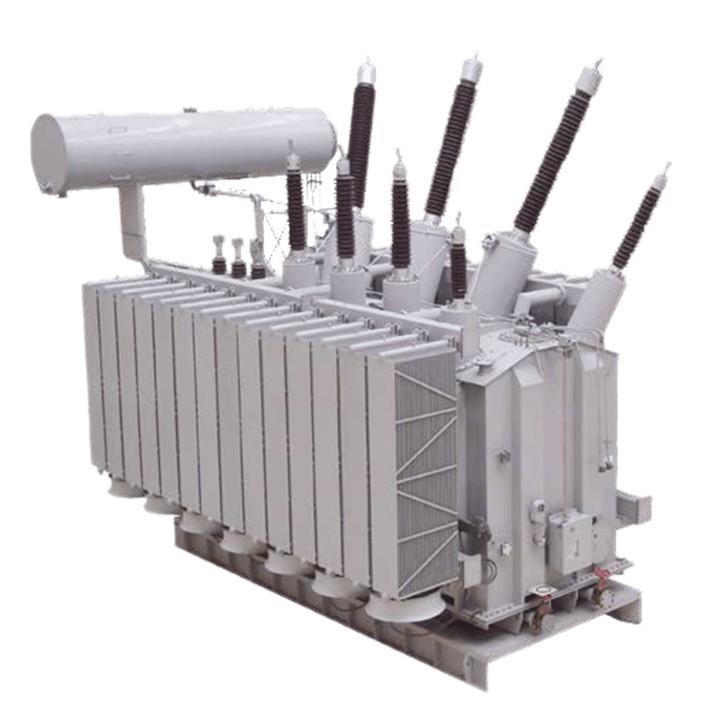
Additionally, economic footprint designs are typically compared for arbitrarily selected existing designs (Figure 2), rather than for two optimally designed transformers. Due to the long service life of power transformers, maintenance costs related to routine replacement require additional parts and planned downtime. All these costs are not included in the bidding phase. After implementing Industry 4.0 principles—predictive maintenance—these can be calculated from the very beginning of equipment design.
3.1 Capitalization Factors
For this purpose, the capitalization factors are as follows:
Where r represents the discount rate for investment. This typically varies between 5-10%, and we selected 6.75% for our calculations. In this case, the expected lifetime of the transformer (t) is 25 years. In equation (4), p represents the annualized electricity per kW of maximum demand. The demand factor represents the ratio of maximum demand to the transformer's rated capacity (0.65). The capital recovery coefficient (f) shows the total future cost of annual payments calculated in current currency. The current electricity price in Central Europe is 0.05 euros (€/kWh). The load loss factor (LLF) is defined as the ratio of average power loss over a period to the loss at peak demand time. The load factor (LF) is the average load of the transformer throughout its entire life cycle, expressed as the equivalent percentage of average to maximum load. In our case, for photovoltaic power plants, LF=25%, thus LLF equals 0.15625 (Figure 1).
From equations (4,5), the capitalization factors (A, B) can be calculated. In equations (4,5), the factor 8760 represents the annual operating hours of the transformer. In equation (B), the load loss cost is calculated. Among all transformers, the most cost-effective and energy-efficient transformer is the one that minimizes the TCO (Figure 2).

A. Carbon Footprint Analysis Objective Function
Analogous to the TCO formula, an objective function can be introduced to evaluate the carbon footprint (CF) of power transformers:
TCO2 = BCP + A* · PNLL + B* · PLL
where TCO2 represents the calculated carbon footprint (g), BCP represents the carbon footprint calculated during the machine manufacturing process. A* and B* are capitalization factors for calculating carbon dioxide emissions (kg/kW) during the transformer's planned service life.
To calculate these analogous capitalization factors, three greenhouse gases (GHG) are considered: carbon dioxide (CO2), methane (CH4), and nitrous oxide (N2O) for each fuel type used in the power grid. This is because, if we calculate using the zero emissions from solar power plants, the resulting transformer would theoretically have minimum mass and maximum losses. The emissions of methane and nitrous oxide are converted to CO2 equivalent emissions by multiplying them with their respective global warming potential factors (I):

where ei is the emission factor in units of (tCO2/MWh), while eCO2,i, eCH4,i and eN2O,i are the emission factors for carbon dioxide, methane, and nitrous oxide respectively for the studied fuel type (i), all in units of (t/GJ). The factor 0.0036 is used to convert GJ to MWh. For fuel i, ni represents the conversion efficiency of fuel i in the transmission system (in percentage %), and λi represents the power loss percentage for fuel i in the transmission system. This paper uses λi = 8% for calculations of each fuel type.

Using the energy structure data of the Hungarian power grid, the values of A*=425 kgCO2/kW and B*=66.5 kgCO2/kW were calculated.
4 Transformer Model
The power transformer modeling employs a simplified two-winding active part (core and windings). This approach is widely used in preliminary design optimization stages because the dimensions of the active part determine the overall transformer size. The geometric and electrical characteristics of the transformer are modeled using key design parameters. These assumptions are widely accepted in industry, providing sufficient accuracy in estimating copper and core losses while significantly simplifying the various possible core and winding configurations.
The preliminary design transformer model clearly defines the outer boundaries of the main active components, which is adequate for early-stage cost calculations. Understanding these key design parameters accelerates engineers' work, and detailed design parameters can be easily determined using standard practices (Figure 2). Transformer manufacturers in Europe and America employ metaheuristic-based optimization methods in practice.
5 Metaheuristic Search
The transformer model employs geometric programming solved by metaheuristic algorithms to address the mathematical model of the preliminary design optimization problem. Two factors determine the superiority of geometric programming solvers. First, modern interior-point-based GP solvers are fast and robust. Second, the mathematical modeling rules of geometric programming guarantee that the obtained solution is globally optimal. Expressions for equality and inequality constraints must be represented using special mathematical formulas called monomials (10) and posynomials (11).

Where ck>0, the α parameters are real numbers, and the values of x variables must be positive. The cost optimization problem for shell-type power transformers can be formulated in a special geometric structure form. However, this mathematical optimization method cannot be applied to core-type power transformers because core-type power transformers have strict requirements for short-circuit impedance. Therefore, by combining the GP method with the branch-and-bound method, a fast and accurate solution method was obtained.
6 Results and Discussion
A. Test Transformer Technical Specifications
Optimization tests were conducted on a 16MVA power transformer with a voltage ratio of 120kV/20kV. The optimization targets were the Total Cost of Ownership (TCO) in the first case and minimum Carbon Footprint (CF). The grid frequency was 50Hz, with a required short-circuit impedance of 8.5%. Parameters were selected in accordance with standards. The transformer cooling method was selected as ONAN, with an ambient temperature specified as 40°C. Therefore, the allowable winding current density limit for the main winding was set to 3A/mm², and for the tap changer winding to 3.5A/mm².
The low-voltage (primary) winding was modeled as a helical winding with CTC (Continuously Transposed Cable), while the high-voltage (secondary) winding was modeled as a disc winding with dual conductors. Considering core material saturation and grid overvoltage, the maximum flux density was limited to 1.7T. Minimum insulation distances were selected based on empirical rules. The cost of electrical steel was selected as 3.5€/kg, and winding material cost as 8€/kg. The carbon footprint cost for electrical steel manufacturing was 1.8kgCO2/kg, and for copper 6.5kgCO2/kg.
| Quantity | Unit | TCO analysis | Carbon footprint analysis |
| Pd |
kW | 130.7 | 139.9 |
Pintt |
kW | 13.3 | 13.1 |
| Ur |
V | 79.2 | 78.9 |
| Mcore |
kg | 15320 | 15014 |
| Mcopper |
kg | 6300 | 5800 |
The optimization results are summarized in Table 2. From the results, it can be seen that the optimal transformer efficiency under CF optimization is lower than the efficiency after TCO analysis. The transformer's voltage per turn is related to the copper-to-iron ratio, and the values are almost identical in both cases. Core losses are relatively small in both cases, with no significant difference. Due to the small LLF of solar power plants, core loss costs are relatively high compared to load loss costs. The main difference lies in copper losses, which are significantly smaller than in the TCO case. Since the price ratio of non-ferrous and ferrous metal smelting is higher than the price ratio of core and copper materials, and the CF of applied materials is relatively higher than the CF of electrical losses, the optimization algorithm tends to adopt designs with less copper to reduce the transformer's CF. Due to the significant difference between the CF of electricity prices and that of copper/iron smelting, the algorithm favors a smaller, less efficient design compared to TCO-based calculations.
7 Conclusion
Currently, there is no ready-made, widely accepted method for determining the carbon footprint of power transformers. In the post-economic era, carbon footprint analyses in literature have been conducted on arbitrarily selected pairs of transformers. However, large power transformers are custom-made for different economic scenarios. To compare optimized designs, two optimization designs were conducted in a practical example. In the first case, TCO optimization was performed; in the second case, the transformer's carbon footprint was minimized. The results show that carbon footprint analysis can yield transformers with lower efficiency than traditional TCO methods. This may be due to the environmental cost of large motors being higher during manufacturing than their losses on the grid. Further research could evaluate the environmental impact of manufacturing time, maintenance, the use of new biodegradable insulating oils, or transformer recycling.