Ⅰ. Problem Background
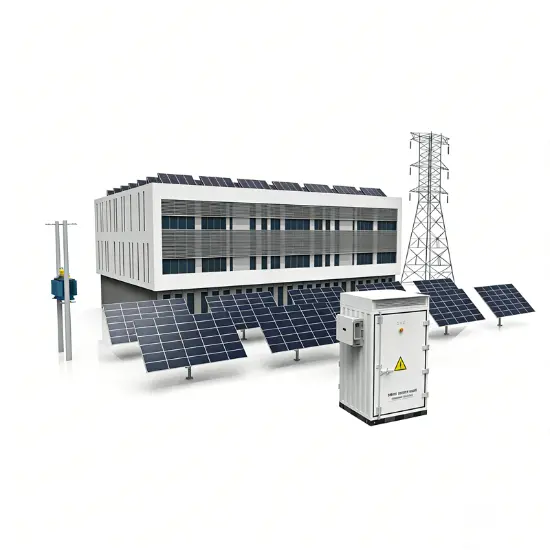
In photovoltaic power stations, containerized step-up transformers (referred to as “PV transformers”) account for approximately 8%–12% of total equipment investment, while their losses exceed 15% of the station’s total losses. Traditional selection methods often overlook lifecycle cost (LCC), resulting in hidden economic losses.
Ⅱ. Core Economic Challenges
High Initial Costs
• Significant price premiums for high-end imported equipment; domestic alternatives remain under-optimized.
Excessive No-load/Load Losses
• Annual energy losses from inefficient transformers can reach 0.5%–1.2% of total power generation.
Uncontrollable Maintenance Costs
• Frequent failures lead to downtime losses; repair costs double in remote areas.
Low Capacity Utilization
• Over-engineering causes prolonged light-load operation and reduced efficiency.
Ⅲ. Economic Optimization Solutions
Precision Sizing Strategy: Avoiding Capacity Redundancy
• Dynamic Capacity Matching Model
Uses local irradiance data + DC-to-AC ratio (typically 1.1–1.3) to calculate optimal transformer load rate (recommended 75%–85%).
Case: A 100MW plant replaced 160MVA conventional transformers with 120MVA PV-dedicated units, reducing initial investment by ¥2.2M while maintaining load losses.
• Voltage Level Optimization
Using 35kV (vs. 33kV) for medium voltage lowers cable costs by 7%–10% and reduces procurement costs for domestic equipment.
Loss Control Technology: Core of Lifecycle Cost Reduction
• Low-Loss Materials
Amorphous-core transformers cut no-load losses by 60%–80%. Despite 15%–20% higher upfront cost, ROI achieved in 3–5 years (calculated at ¥0.4/kWh).
• Smart Capacity Adjustment
On-load tap changers (OLTC) enable low-capacity mode during low-irradiance periods, reducing no-load losses by >40%.
Localization and Standardization Synergy
• Domestic Core Component Substitution
Adopting domestically produced nanocrystalline strips (30% cheaper than Hitachi Metals) and epoxy resin casting systems.
• Modular Design
Prefabricated smart PV substations (integrated transformers, ring main units, monitoring systems) cut on-site installation costs by 20% and shorten timelines by 15 days.
Smart O&M System: Reducing Hidden Costs
• IoT Monitoring Terminals
Real-time tracking of oil temperature, partial discharge, and core grounding currents optimizes maintenance cycles, reducing unexpected downtime.
Data: Smart diagnostics increase MTBF to 12 years and lower O&M costs by 35%.
• Grid Demand Response Participation
Adjusting transformer taps for voltage support generates grid ancillary service revenue (¥30–80/MW·event).
Financial Leverage Applications
• Green Finance Instruments
Utilize low-cost green loans (10%–15% below benchmark rates) for efficient equipment procurement.
• Energy Performance Contracting (EPC)
Suppliers guarantee efficiency thresholds, compensating for electricity cost gaps if unmet.
Ⅳ. Economic Quantification (100MW Plant Case)
Item |
Conventional Solution |
Optimized Solution |
Annual Benefit |
Initial Investment |
¥12M |
¥9.8M |
Save ¥2.2M |
No-load Losses |
45kW |
18kW (amorphous core) |
Save ¥230k/yr |
Load Losses (75% load) |
210kW |
190kW (copper foil winding) |
Save ¥160k/yr |
O&M Costs |
¥500k/yr |
¥320k/yr |
Save ¥180k/yr |
Payback Period |
— |
2.8 years |
>22% IRR |