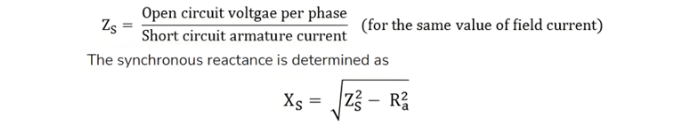
Synchronous Impedance Method

The Synchronous Impedance Method, also known as the EMF Method, replaces the impact of armature reaction with an equivalent imaginary reactance. To calculate voltage regulation using this method, the following data are required: armature resistance per phase, the Open-Circuit Characteristic (OCC) curve depicting the relationship between open-circuit voltage and field current, and the Short-Circuit Characteristic (SCC) curve showing the relationship between short-circuit current and field current.
For a synchronous generator following are the equation given below:

To calculate the synchronous impedance Zs, measurements are taken, and the value of Ea (armature-induced EMF) is derived. Using Ea and V (terminal voltage), voltage regulation is then computed.
Measurement of Synchronous Impedance
Synchronous impedance is determined through three primary tests:
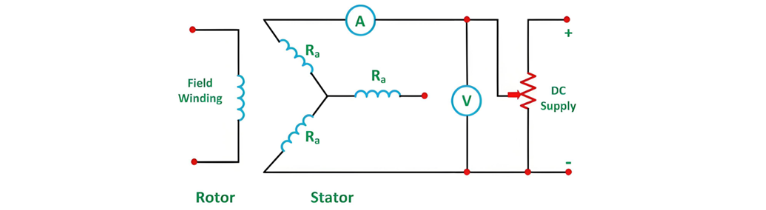
DC Resistance Test
In this test, the alternator is assumed to be star-connected with its DC field winding open-circuited, as depicted in the circuit diagram below:
DC Resistance Test
The DC resistance between each pair of terminals is measured using either the ammeter-voltmeter method or Wheatstone’s bridge. The average of three measured resistance values Rt is calculated, and the per-phase DC resistance RDC is derived by dividing Rt by 2. Considering the skin effect, which increases the effective AC resistance, the per-phase AC resistance RAC is obtained by multiplying RDC by a factor of 1.20–1.75 (typical value: 1.25), depending on the machine size.
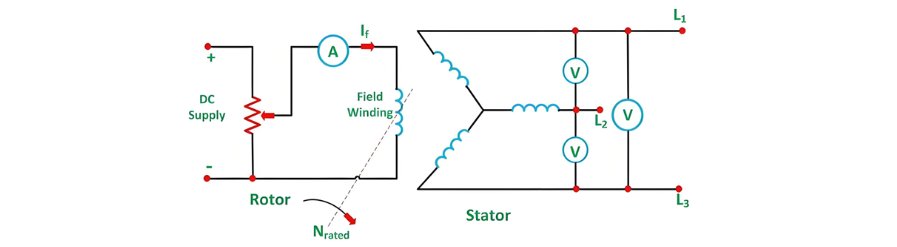
Open Circuit Test
To determine synchronous impedance via the open-circuit test, the alternator operates at rated synchronous speed with load terminals open (loads disconnected) and field current initially set to zero. The corresponding circuit diagram is shown below:
Open Circuit Test (Continued)
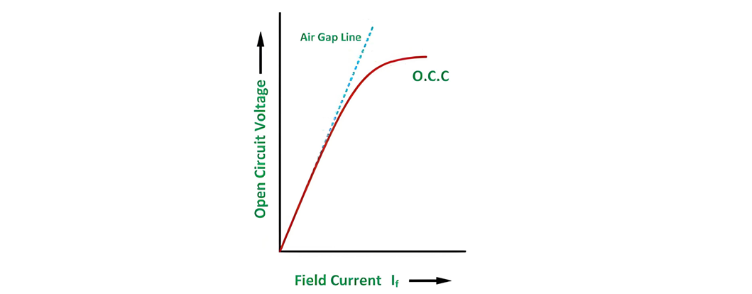
After setting the field current to zero, it is gradually increased in steps while measuring the terminal voltage Et at each increment. The excitation current is typically raised until the terminal voltage reaches 125% of the rated value. A graph is plotted between the open-circuit phase voltage Ep = Et/sqrt 3 and the field current If, yielding the Open Circuit Characteristic (O.C.C) curve. This curve mirrors the shape of a standard magnetization curve, with its linear region extended to form an air gap line.
The O.C.C and air gap line are illustrated in the figure below:
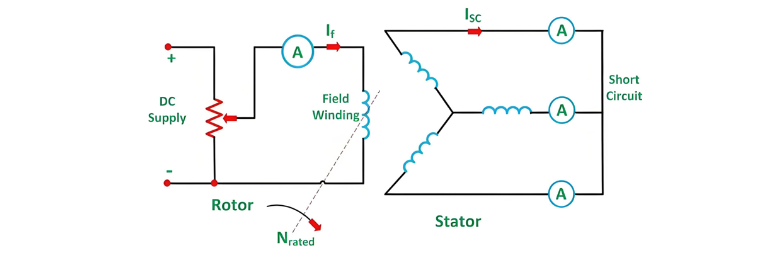
Short Circuit Test
In the short circuit test, the armature terminals are shorted via three ammeters, as illustrated in the figure below:
Short Circuit Test (Continued)
Before starting the alternator, the field current is reduced to zero, and each ammeter is set to a range exceeding the rated full-load current. The alternator is operated at synchronous speed, with the field current increased in gradual steps—similar to the open-circuit test—while measuring the armature current at each increment. The field current is adjusted until the armature current reaches 150% of the rated value.
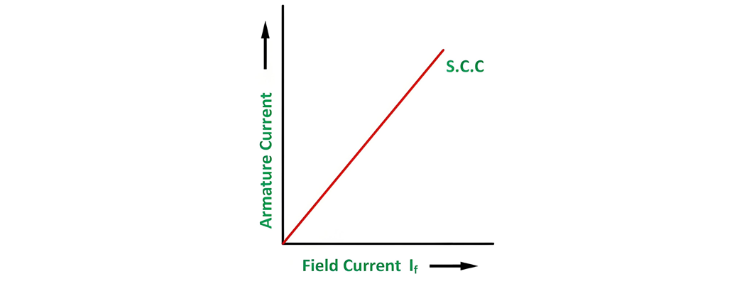
For each step, the field current If and the average of three ammeter readings (armature current Ia) are recorded. A graph plotting Ia against If yields the Short Circuit Characteristic (S.C.C), which typically forms a straight line, as shown in the figure below.
Calculation of Synchronous Impedance
To calculate the synchronous impedance Zs, first overlay the Open-Circuit Characteristic (OCC) and Short-Circuit Characteristic (SCC) on the same graph. Next, determine the short-circuit current ISC corresponding to the rated alternator voltage per phase Erated. The synchronous impedance is then derived as the ratio of the open-circuit voltage EOC (at the field current that yields Erated to the corresponding short-circuit current ISC, expressed as s = EOC / ISC.
The graph is shown below:
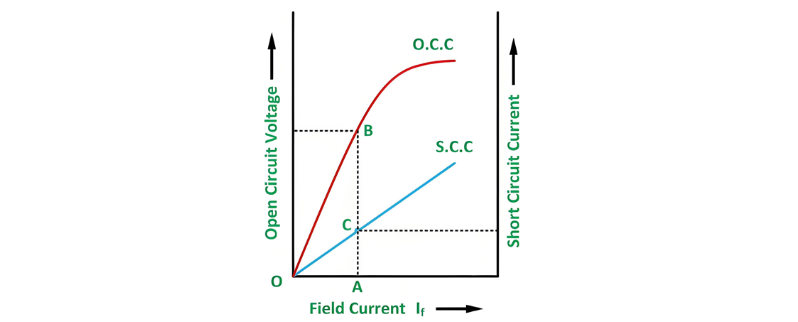
From the above figure, consider the field current If = OA, which produces the rated alternator voltage per phase. Corresponding to this field current, the open-circuit voltage is represented by AB.

Assumptions of the Synchronous Impedance Method
The synchronous impedance method assumes that synchronous impedance (determined from the ratio of open-circuit voltage to short-circuit current via OCC and SCC curves) remains constant when these characteristics are linear. It further assumes that flux under test conditions matches that under load, though this introduces error as short-circuited armature current lags voltage by ~90°, causing predominantly demagnetizing armature reaction. Armature reaction effects are modeled as a voltage drop proportional to armature current, combined with reactance voltage drop, with magnetic reluctance assumed constant (valid for cylindrical rotors due to uniform air gaps). At low excitations, is constant (linear/unsaturated impedance), but saturation reduces beyond the OCC's linear region (saturated impedance). This method yields higher voltage regulation than actual loading, earning it the term pessimistic method.